Multiwfn forum
Multiwfn official website: http://www.shanxitv.org/multiwfn. Multiwfn forum in Chinese: http://bbs.keinsci.com/wfn. E-mail of admin: sobereva[at]sina.com
You are not logged in.
- Topics: Active | Unanswered
Pages: 1
#1 Re: Multiwfn and wavefunction analysis ? << Poincare-Hopf relationship is not satisfied >> ? 2021-09-02 11:49:47
OK. Thanks for your advice.
#2 Re: Multiwfn and wavefunction analysis ? << Matrix diagonalization exceed max cycle before convergence >> ? 2021-08-31 18:45:48
My system info is in this post: http://www.shanxitv.org/wfnbbs/viewtopic.php?id=547
#3 Re: Multiwfn and wavefunction analysis ? << Poincare-Hopf relationship is not satisfied >> ? 2021-08-31 18:44:46
Hello,
Here are the infos:
>> Which real space function did your analyzed in topology analysis module?
Electron density
>> How did you search the CPs (which commands you inputted?)
I am using the following sequence of commands:
2 <- Topological analysis
-1 <- Set CP searching parameters
1 <- Set maximal iterations:
2500
2 <- Set scale factor of stepsize
0.5
0
2 <- Search CPs from nuclear positions
3 <- Search CPs from midpoint of atom pairs
8 <- Generate the path connected (3,-3) and (3,-1) #9 <- Generate the path connected (3,+1) and (3,+3)
-5 <- Modify or print detail or export paths, or calculate property along a path
1 <- Print summary of paths
4 <- Save points of all paths to paths.txt in current folder
6 <- Export paths as paths.pdb file in current folder
0 <- Return
0 <- Print and visualize all generated CPs, paths and surfaces
-4 <- Modify or export CPs (critical points)
-1 <- Print summary of CPs (in Angstrom)
4 <- Save CPs to CPs.txt in current folder
6 <- Export CPs as CPs.pdb file in current folder
0 <- Return
7 <- Show real space function values at specific CP or all CPs
0 <- If input 0, then properties of all CPs will be outputted to CPprop.txt in current folder
-10 <- Return
>> How did you generate your input file? What keywords were used in your quantum chemistry program?
I generate the input using GAUSSIAN.
The keywords were: #p scf=qc int=ultrafine output=wfn pm7
Here I put a zip with the input and output wavefunction and unformatted check file.
>> What is the chemical formula of your system?
My system is a boron-nitride nanotube with 4 cadmium atoms. The nanotubes ends were competed with hydrogens.
#4 Multiwfn and wavefunction analysis ? << Poincare-Hopf relationship is not satisfied >> ? 2021-08-24 19:25:10
- icamps
- Replies: 4
Hello,
I found the following warning when searching for CPs:
Poincare-Hopf relationship verification: 164 - 232 + 101 - 14 = 19
Warning: Poincare-Hopf relationship is not satisfied, some CPs may be missing
How to improve the search?
I changed the maximal iterations to 2500 and the scale factor of stepsize to 0.5, but nothing changed.
Regards,
Camps
#5 Multiwfn and wavefunction analysis ? << Matrix diagonalization exceed max cycle before convergence >> ? 2021-08-24 19:22:48
- icamps
- Replies: 2
Hello,
I got the error:
Matrix diagonalization exceed max cycle before convergence
How/where can I increase the number of cycles?
Regards,
Camps
#6 Re: Multiwfn and wavefunction analysis ? << Values from critical points different from graphical properties >> ? 2021-07-01 20:27:17
Ok, thank you.
#7 Re: Multiwfn and wavefunction analysis ? << Values from critical points different from graphical properties >> ? 2021-06-21 17:10:51
Well, I check the CP number before making the comparison.
Also, after re-running all the calculations now, the CP number changes, but again, the values are different in the graph from the exported data.
Could you, check this for me, please? Could it be a issue with units? A difference between the units on the exported file and in the graph?
Thanks in advance.
#8 Re: Multiwfn and wavefunction analysis ? << Values from critical points different from graphical properties >> ? 2021-06-18 11:07:48
Thank you.
I already sent the email.
#9 Multiwfn and wavefunction analysis ? << Values from critical points different from graphical properties >> ? 2021-06-17 18:06:15
- icamps
- Replies: 6
Hello,
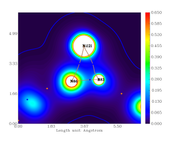
I did the critical point analysis, exported the file with all the data and also made the plots for the electronic density, its Laplacian, the ELF and LOL index.
When comparing the obtained data for bond critical points, between the text file and graph, they don't correspond, i.e. the value are different from the scale.
For example, from the calculation, the electronic density at the BCP389 (between Ni121 and N86) is 0.3246659890E+00. From the graph, the color should be cyan but it is blue (indicating lower density).
I checked the BCP number with the 3D plot with labels.
The same applies to ELF and LOL.
Text data:
---------------- CP 389, Type (3,-1) ----------------
Position (Bohr): 12.26849825471668 6.06817862429313 -3.47032776419174
Density of all electrons: 0.3246659890E+00
Density of Alpha electrons: 0.1623329945E+00
Density of Beta electrons: 0.1623329945E+00
Spin density of electrons: 0.0000000000E+00
Lagrangian kinetic energy G(r): 0.6218513930E-01
G(r) in X,Y,Z: 0.8830750583E-02 0.2785847921E-01 0.2549590951E-01
Hamiltonian kinetic energy K(r): 0.3781322392E+00
Potential energy density V(r): -0.4403173785E+00
Energy density E(r) or H(r): -0.3781322392E+00
Laplacian of electron density: -0.1263788400E+01
Electron localization function (ELF): 0.9804412408E+00
Localized orbital locator (LOL): 0.8762567777E+00
Local information entropy: 0.3321890626E-02
Reduced density gradient (RDG): 0.1000000000E+03
Reduced density gradient with promolecular approximation: 0.1000000000E+03
Sign(lambda2)*rho: -0.3246659890E+00
Sign(lambda2)*rho with promolecular approximation: -0.2177479096E+00
Corr. hole for alpha, ref.: 0.00000 0.00000 0.00000 : -0.3880061880E-06
Source function, ref.: 0.00000 0.00000 0.00000 : 0.7122320441E-02
Wavefunction value for orbital 1 : -0.3039836614E-05
Average local ionization energy (ALIE): 0.6092467948E+00
Delta_g (under promolecular approximation): 0.4398354939E+00
Delta_g (under Hirshfeld partition): 0.7055014066E+00
User-defined real space function: 0.1000000000E+01
ESP from nuclear charges: 0.6067031133E+02
ESP from electrons: -0.5945176577E+02
Total ESP: 0.1218545568E+01 a.u. ( 0.3315831E+02 eV, 0.7646495E+03 kcal/mol)
Electron density graph:
#10 Multiwfn and wavefunction analysis ? << Compatible codes for periodic system >> ? 2020-11-25 01:22:53
- icamps
- Replies: 1
Hello Prof. Lu and Multiwfn's users,
From my previous experience, I found Multiwfn the perfect tool for AIM analysis for isolated systems.
Now, I need to perform AIM study for periodic system.
So, I was wondering which of the codes that are compatible with Multiwfn for isolated system, and perform calculations for periodic system (like NWChem, for example) can be used together with Multiwfn to do AIM analysis for periodic systems calculations.
Regards,
Camps
#11 Re: Multiwfn and wavefunction analysis ? << Graphs scale >> ? 2020-10-23 18:08:17
I got it!
Thank you.
#12 Re: Multiwfn and wavefunction analysis ? << Graphs scale >> ? 2020-10-21 11:52:01
Thanks for your replay.
I followed your recommendation but the behavior continues.
Both graphs have different size scales. The first one (just the gradient lines) both X and Y axis have the same size (extend to the same maximum value), so, this graph is square. In case of the color-filled map, the Y axis is different (lower max value) than the X axis, so, this graph is rectangular.
As I would like to put both graphs together for comparison, it is desirable that both have the same scales.
Regards,
Camps
#13 Re: Multiwfn and wavefunction analysis ? << "Best" bond order analysis method >> ? 2020-10-21 11:23:53
Thank you very much.
#14 Re: Multiwfn and wavefunction analysis ? << ORCA and Multiwfn >> ? 2020-10-21 11:19:13
Thank you very much.
#15 Multiwfn and wavefunction analysis ? << Graphs scale >> ? 2020-10-20 21:35:36
- icamps
- Replies: 4
Hello,
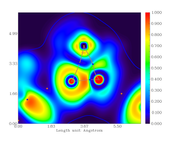
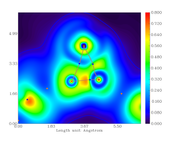
I am doing topological study using one script. In this script, I generate several graphs for different properties.
My problem is that the first graph has an scale different from the other ones.
I analyzed my scrip but didn't find where is the problem.
Here are the script and two graphs.
Regards,
Camps

#16 Multiwfn and wavefunction analysis ? << "Best" bond order analysis method >> ? 2020-10-20 12:35:39
- icamps
- Replies: 2
Hello,
In Multiwfn there are several methods/theories for calculating bond orders.
Right now, I am working with carbon and boron-nitride nanotubes interacting with heavy metals and amino-acids.
In your own experience, which one of those methods is the must, let said, accurate or the one that better represents the bond character?
Regards,
Camps
#17 Multiwfn and wavefunction analysis ? << ORCA and Multiwfn >> ? 2020-10-20 12:30:07
- icamps
- Replies: 2
Hello,
I would like to know what are the files that should be generated using ORCA in order to use Multiwfn and perform all the analysis implemented on it.
For example, for Gaussian, there are analysis that only works for wavefunction file whereas other analysis works only with formatted check files.
Regards,
Camps
#18 Re: Multiwfn and wavefunction analysis ? << Identifying yellow points >> ? 2020-05-19 19:47:58
Thanks a lot!
#19 Multiwfn and wavefunction analysis ? << Bond Order calculation using command-line/script >> ? 2020-05-19 17:54:37
- icamps
- Replies: 1
Hi,
I would like to calculate the bond order of my system using the command-line and only one script.
The problem I am facing is that some of the bond order matrix are always saved to the same file bndmat.txt overwriting the previous calculations (very different behavior when producing images) and some are just wrote to the screen (that I can face sending the output to a file).
Is there a way to save the bond order matrix to different files or I just have to setup each calculation individually?
Regards,
Camps
#20 Re: Multiwfn and wavefunction analysis ? << Identifying yellow points >> ? 2020-05-19 11:45:45
Thanks, but I just read about brown, blue and orange circles, nothing about yellow ones.
#21 Multiwfn and wavefunction analysis ? << Identifying yellow points >> ? 2020-05-18 22:31:05
- icamps
- Replies: 4
Hi,
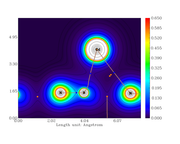
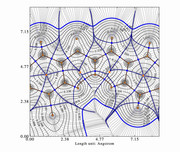
I created an electron density gradient image:
But I don't understand what the yellow points are representing.
I didn't change any default color definition.
#22 Multiwfn and wavefunction analysis ? << Multiwfn + CRYSTAL14 >> ? 2018-09-20 22:51:16
- icamps
- Replies: 2
Hello,
I wonder if it is possible to use Multiwfn with the CRYSTAL14 wavefunction output.
(some calculations are made for periodic systems)
Regards,
Camps
#23 Re: Multiwfn and wavefunction analysis ? << SIESTA to Multiwfn >> ? 2018-08-23 11:19:16
Dear Camps,
Unfortunately, this cannot be easily realized. AFAIK, Siesta employs numerical basis set, however, to carry out wavefunction analysis in Multiwfn, the wavefunction must be represented by Gaussian type functions (GTFs).
Best regards,
Tian
Dear Tian,
I was thinking about it.
Multiwfn calculate the electron density from the system wavefuncion using Gaussian type functions, ok, I understand the problem here with SIESTA. But if the electron density is already calculated, Multiwfn could read the file and make the analysis?
Regards,
Camps
#24 Re: Multiwfn and wavefunction analysis ? << SIESTA to Multiwfn >> ? 2018-08-16 12:21:19
I got it!
Thanks you.
Regards,
Camps
#25 Re: Multiwfn and wavefunction analysis ? << Rotating 2D resulting image >> ? 2018-08-16 12:19:54
Thank you for your answer.
The problem with option 1, is that the rotating the image is easy. The problem is the numbers, text, etc.
regarding the second option, I will look for this, maybe changing the order of the points, change the final orientation.
Regards,
Camps
#26 Multiwfn and wavefunction analysis ? << Rotating 2D resulting image >> ? 2018-08-15 17:43:24
- icamps
- Replies: 3
Hello,
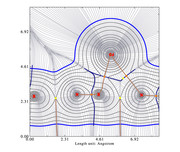
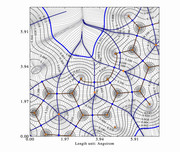
I'm making a topology study. One of the output is the electron density gradient (with lines, without atom labels, and with isovalues) of the same region of two molecules (the only difference is that one molecule has an extra atom in a region far from the first region).
My problem is that the graphics are oriented different and this difficult the discussion.
I would like to know how do I rotate one of them (inside Multiwfn) in order to facilitate the comparison.
The images are:
Thanks in advance.
Camps
#27 Multiwfn and wavefunction analysis ? << SIESTA to Multiwfn >> ? 2018-08-15 15:56:47
- icamps
- Replies: 4
Hello,
I was wondering if there is any tool that can convert the wavefunction file obtained from SIESTA to a format recognized by Multiwfn.
SIESTA is specialized in performing efficient electronic structure calculations and ab initio molecular dynamics simulations of molecules and solids (https://departments.icmab.es/leem/siesta/).
Regards,
Camps
#28 Re: Multiwfn and wavefunction analysis ? << errors running Multiwfn in Linux >> ? 2018-05-18 18:54:00
Thank you very much.
#29 Multiwfn and wavefunction analysis ? << errors running Multiwfn in Linux >> ? 2018-05-17 22:58:43
- icamps
- Replies: 2
Hello,
I am running Multiwfn in 64bit OpenSUSE linux (Leap 42.2) as:
"Multiwfn Frag1.wfn < input_analyses > Frag1_Multiwfn.out"
Trying to do AIM charge analyses and basin analyses (critical points, graphs, etc.) I am getting the error:
"forrtl: severe (24): end-of-file during read, unit -4, file /proc/####/fd/0 (here #### is a four digit number)"
I set the following configurations:
- added "ulimit -s unlimited" and "export KMP_STACKSIZE=64000000" to my batch profile.
- checked "/sbin/sysctl -a|grep shmmax", returning "kernel.shmmax = 18446744073709551615".
- installed motif (both 32 and 64bits libraries).
- put Multiwfn in a system protected folder available to all users via local profile (with Multiwfn in the path and Multiwfnpath defined).
- put Multiwfn in a local user folder (with Multiwfn in the path and Multiwfnpath defined).
- used 64bits 3.6dev version and 3.5noGUI version.
In the case of basin analyses, the PDFs are generated but the program suddenly stop with the error above.
If configured to generate PNG graphs, the images are not generated and the error returned is:
"forrtl: severe (174): SIGSEGV, segmentation fault occurred"
I change to Linux because in my Windows box, the program also stop working.
I appreciate any help.
The input_analyses files are:
For AIM charges:
17 <- Basin analysis module
1 <- Generate basins
1 <- Electron density
3 <- High quality grid for more accurate result
7 <- Integrate real space functions in AIM basins with mi$
2 <- Integrate and meanwhile refine basin boundary
1 <- Electron density
and for basis graphs:
2 <- Topological analysis
2 <- Search CPs from nuclear positions
3 <- Search CPs from midpoint of atom pairs
8 <- Generate the path connected (3,-3) and (3,-1)
9 <- Generate the path connected (3,+1) and (3,+3)
-5 <- Modify or print detail or export paths, or calculate property along $
1 <- Print summary of paths
0 <- Print and visualize all generated CPs, paths and surfaces
-4 <- Modify or export CPs (critical points)
1 <- Print summary of CPs (in Bohr)
4 <- Save CPs to CPs.txt in current folder
6 <- Export CPs as CPs.pdb file in current folder
0 <- Return
-10 <- Return
4 <- Output and plot specific property in a plane
1 <- Electron Density
6 <- Gradient lines map with/without contour lines
300,300 <- How many grids in the two dimensions respectively?
4 <- Define the plane to be plotted: Define by three atoms
18,20,21 <- Number of atoms
-8 <- Change length unit of the graph to Angstrom
-4 <- Switch ON/OFF of reversing ticks
6 <- Generate and show interbasin paths
15 <- Draw a contour line of vdW surface (electron density=0.001)
0 <- Save the graph to a file
1 <- Disable showing atom labels and reference point
0 <- Save the graph to a file
Pages: 1