If you want to visualize sigma-hole, you should plot contour line map of ESP rather than vector field map of electron density.
]]>I did a scan of a molecule of HOCl with a variable electric field and I tried to do the vector field of the molecules. Here'sn input example:
%chk=field_1.chk
%mem=8GB
%nprocs=4
#p b3lyp/6-31+G(d,p) Field=z-200 output=wfn EmpiricalDispersion=GD3BJ
Title Card Required
0 1
O 0.03617200 1.10337600 0.00000000
H -0.90429300 1.32914000 0.00000000
Cl 0.03617200 -0.59742000 0.00000000
field_1.wfn
However, all I saw is this 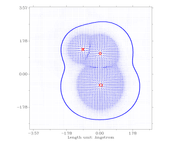 .
.
So, I don't know if there's something I'm doing wrong or not, since the manual does not show something like that.
]]>I applied an electric field on a HOCl molecule along with the reaction coordinate so we could visualize any effect on the sigma hole of Cl. However, when I put them on Multiwfn, I see blue arrows without contrast. Is there something wrong with my version, or should I check something else?
I really appreciate any help you can provide.
]]>