You can export positions of grid points and function values to a .txt file via corresponding option in post-process menu of main function 4, then you can use other software to replot the map. However, the data of vdW contour line cannot be exported.
]]>By the way, Can this plot be extracted to a script like matplotlib or gnuplot such that one can tweek through the setting?
]]>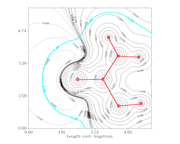
Are there an method by which I can fit the image inside the rectangle? Or can I increase the size of the rectangle?
]]>