It seems that you identified an incorrect CP.
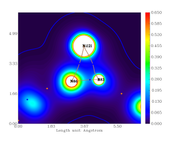
I have reproduce your AIM analysis, as can be seen from the following map, the BCP between N86 and Ni121 is 390
I checked its density, the value is 0.06968 a.u.
Then I plotted electron density map for the plane defined by atoms 121, 86, 102:
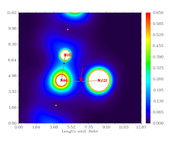
As indicated by the arrow, the BCP between N86 and Ni121 indeed has electron density of about 0.06968 a.u.
]]>Also, after re-running all the calculations now, the CP number changes, but again, the values are different in the graph from the exported data.
Could you, check this for me, please? Could it be a issue with units? A difference between the units on the exported file and in the graph?
Thanks in advance.
]]>
Note that I just updated Multiwfn on the website, new improvement:
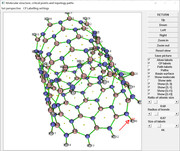
In the GUI of topology analysis module, a new option has been added to menu: "CP labelling settings" - "Labelling only one CP". After choosing it and input a CP index, e.g. 19, then only label of CP 19 could be shown when "CP labels" check box has been selected. This improvement makes finding a specific CP from topology map much easier for large systems.
I already sent the email.
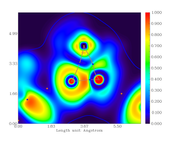
]]>I did the critical point analysis, exported the file with all the data and also made the plots for the electronic density, its Laplacian, the ELF and LOL index.
When comparing the obtained data for bond critical points, between the text file and graph, they don't correspond, i.e. the value are different from the scale.
For example, from the calculation, the electronic density at the BCP389 (between Ni121 and N86) is 0.3246659890E+00. From the graph, the color should be cyan but it is blue (indicating lower density).
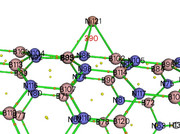
I checked the BCP number with the 3D plot with labels.
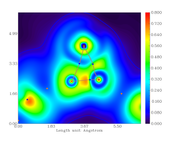
The same applies to ELF and LOL.
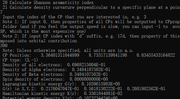
Text data:
---------------- CP 389, Type (3,-1) ----------------
Position (Bohr): 12.26849825471668 6.06817862429313 -3.47032776419174
Density of all electrons: 0.3246659890E+00
Density of Alpha electrons: 0.1623329945E+00
Density of Beta electrons: 0.1623329945E+00
Spin density of electrons: 0.0000000000E+00
Lagrangian kinetic energy G(r): 0.6218513930E-01
G(r) in X,Y,Z: 0.8830750583E-02 0.2785847921E-01 0.2549590951E-01
Hamiltonian kinetic energy K(r): 0.3781322392E+00
Potential energy density V(r): -0.4403173785E+00
Energy density E(r) or H(r): -0.3781322392E+00
Laplacian of electron density: -0.1263788400E+01
Electron localization function (ELF): 0.9804412408E+00
Localized orbital locator (LOL): 0.8762567777E+00
Local information entropy: 0.3321890626E-02
Reduced density gradient (RDG): 0.1000000000E+03
Reduced density gradient with promolecular approximation: 0.1000000000E+03
Sign(lambda2)*rho: -0.3246659890E+00
Sign(lambda2)*rho with promolecular approximation: -0.2177479096E+00
Corr. hole for alpha, ref.: 0.00000 0.00000 0.00000 : -0.3880061880E-06
Source function, ref.: 0.00000 0.00000 0.00000 : 0.7122320441E-02
Wavefunction value for orbital 1 : -0.3039836614E-05
Average local ionization energy (ALIE): 0.6092467948E+00
Delta_g (under promolecular approximation): 0.4398354939E+00
Delta_g (under Hirshfeld partition): 0.7055014066E+00
User-defined real space function: 0.1000000000E+01
ESP from nuclear charges: 0.6067031133E+02
ESP from electrons: -0.5945176577E+02
Total ESP: 0.1218545568E+01 a.u. ( 0.3315831E+02 eV, 0.7646495E+03 kcal/mol)
Electron density graph: