Thanks a lot for your help.
I was able to successfully plot the graph for the test molecule I3 but ran into a problem when plotting the CD for he molecule under investigation.
Unfortunately, I cannot understand on which axis I need to integrate, what to study the charge transfer of the M-M-donor contact?
To calculate the CD plot, it is required to integrate along the Z-axis. In the calculation, the Orca program orientates the molecule in an arbitrary direction (Fig. a). Please tell me if it is possible to reorient the molecule so that the analyzed contacts M-M-donor were located on the Z-axis (Fig. b) for calculating the CD plot.
How to get coordinates of atoms for CD curve?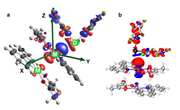
Best regards
Eugene
P.s.:
Thank you for pointing to your new interesting work. I will certainly quote this article in work on the study of non-covalent interactions.
The Charge Displacement Curve can be easily plotted via main function 13, see Section 4.13.6 of Multiwfn manual, relevant introduction is given in Section 3.16.14.
The 2D map of electron density difference can be plotted via main function 4, see Section 4.4.8 for example.
BTW: The following map presented in SI of Carbon 171 (2021) 514-523 (https://doi.org/10.1016/j.carbon.2020.09.048), which is my recent publication, was generated by Multiwfn
Best regards,
Tian
]]>In my study, there is a need to analyze changes in charge transfer. I would like to use the Charge Displacement function (CD), which allows you to analyze and visualize changes in charge transfer. However, I cannot figure out how to plot the CD.
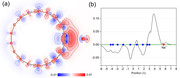
As indicated in the article, it is necessary to construct an electron density difference map and integrate it along the z-axis.
"To make the picture of the bonding which emerges from the density difference plots more quantitative, we show, below each one, the curve representing the partial integral of the density difference along the internuclear axis. This thus measures the actual electronic charge fluctuation with respect to the isolated fragments, as one moves from left to right along the internuclear axis (z) and is defined as follows:

where Δq, is the electron density of the complex minus that of the two isolated fragments. The red dots on the curves in Figures mark the nuclear positions, while the dashed vertical line marks the fragment boundary defined earlier. DOI:10.1021/ja0772647, 10.3390/molecules25020300"
Tell me, please, how do I integrate the electronic density difference map with Multiwfn?
I managed to construct a 1D map of the electronic density difference as specified in detail in the manual to Multiwfn. But I can't figure out how to integrate?
I really hope that such a useful function will appear in the future in the Multiwfn program.
Thank you in advance for your answers.
--
Best regards
Eugene