Since q_CT_positive and q_CT_negative differ with other only by a sign, commonly only q_CT_positive is reported.
]]>For example in this case;
(a) positive portion: 0.410
(b) negative portion: -0.410
(c) the distance of the positive and negative parts: 0.820
because reports in research journals provide no explanation; whether q_CT is used is the positive or negative part. Usually, they only provide the value q_CT (without telling the reader; whether they are using the positive or negative part of q_CT)
]]>The choice of isovalue only affects the graphical effect of isosurface map, while grid data of EDD is fully independent of isovalue. Therefore, q_CT is never affected by isovalue of EDD you inputted in GUI.
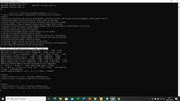
As shown in your output information, the q_CT and D_CT have already been printed by Multiwfn:
q_CT (positive and negative parts):
Distance of CT in x,y,z (Angstrom):
I managed to get a charge transfer analysis. However, when I created the "electron density difference" grid, I tried to change the iso value to 0.005 (according to Prof. Tian Lu's suggestion in the manual book), and I tried to change it to 0.002. Finally, the EDD surface becomes larger when using the 0.002 iso value. Is it better if I use iso value 0.005 or 0.002 yeah sir?
I obtained the same charge transfer analysis on each of the previous EDD grids (0.005 and 0.002).
Besides that, where do I calculate the q_CT and d_CT values based on the charge transfer analysis output?
q_CT (positive and negative parts): 0.410 -0.410 a.u.
Barycenter of positive part in x,y,z (Angstrom): 0.091 0.665 0.001
Barycenter of negative part in x,y,z (Angstrom): 0.816 -0.474 -0.001
Distance of CT in x,y,z (Angstrom): 0.725 1.139 0.001 D index: 1.350
Dipole moment variation (a.u.) : 0.561 -0.882 -0.001 Norm: 1.045
Dipole moment variation (Debye): 1.426 -2.241 -0.002 Norm: 2.657
RMSD of positive part in x,y,z (Angstrom): 2.671 1.810 0.789 Total: 3.321
RMSD of negative part in x,y,z (Angstrom): 2.902 1.631 0.737 Total: 3.409
Difference between RMSD of positive and negative parts (Angstrom):
X: -0.231 Y: 0.179 Z: 0.052 delta_sigma index: -0.088
H_x: 2.786 H_y: 1.721 H_z: 0.763 H_CT: 2.084 H index: 3.365 Angstrom
t index: -0.734 Angstrom
Overlap integral between C+ and C- (i.e. S+- index): 0.934267
Thanks Prof.
]]>I tried more, failed Sir. Below, my task in Gaussian 09
My task for calculation was:
For ground states:
(1) "#n B3LYP/6-31G(d,p) SP output=wfn"
(2) "#n B3LYP/6-31G(d,p) SP density output=wfn"
For excited states:
(1) "# B3LYP/6-31G(d,p) TD output=wfn"
(2) "# B3LYP/6-31G(d,p) TD(ROOT=1,SINGLET) output=wfn"
(3) "# B3LYP/6-31G(d,p) TD(ROOT=1,SINGLET) density output=wfn"
Why all my calculations, none of them work to get the electron density difference?
Please, help me, Sir
]]>Before using this function to analyze CT, please make sure that isosurface map of electron density difference meets your expectation. I cannot easily answer why q_CT is exactly zero without inspecting the isosurface map.
BTW: Note that if you are using relatively old version of Gaussian (older than g09 C.01), you must also add "density" keyword for TDDFT task, otherwise the wavefunction in the exported .wfn file will correspond to the ground state.
]]>in this section of "4.18.3 Analyze charge-transfer during electron excitation based on the electron density difference" on pages 658. How to task for obtained "extP2.wfn and basP2.wfn"?
I tried using several task, as "# B3LYP/6-31G(dp) TD output=wfn; #B3LYP/6-31G(dp) TD(ROOT=1,SINGLET) output=wfn" for excited states; and, I used task "#n B3LYP/6-31G(dp) SP output=wfn" for ground states; but, I obtained qCT value of 0 (zero).
Cheers,
Mono
]]>