Thanks so much for pointing out what I was doing wrong. I'll check the Section 4.5.5.
Best,
Dimuthu]]>
Please carefully check the example in Section 4.5.5 of manual, a complete example of generating grid data of electron density difference is given.
]]>I uploaded the isosurface map here. To create this, I input the P20H12-melamine.fchk file, choose 5 from the menu to calculate grid data, then choose 0 and substract the P20H12.fchk and melamine.fchk files and then choose 1 to calculate electron density.
Please let me know about any mistakes I'm making in the process.
Thank you!
Best,
Dimuthu
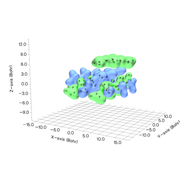 ]]>
]]>I think the grid data of electron density difference you generated is problematic. After calculating the grid data, please do not forget to visualize its isosurface to make sure it is correct, you can also upload the isosurface map so that I can check.
Best,
Tian
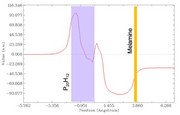
]]>Thank you so much for the VMD code that transforms my system into xy plane. I attached a charge displacement curve I obtained for one of my systems. (P20H12 + melamine) The CDC values are very large and I was just wondering if that could be right.
Could you please let me know if there is an obvious mistake that I have made?
How can I get an idea about the amount of charge transferred in the system?
Thank you!
Best,
Dimuthu
 ]]>
]]>You can use my VMD script to reorientate your system, so that the graphitic carbon nitride surface is parallel to XY plane.
Download VMD program (http://www.ks.uiuc.edu/Research/vmd/), boot up it and copy below commands into VMD console window to define a new command named "alignplane"
proc alignplane {ind1 ind2 ind3} {
set atm1 [atomselect top "serial $ind1"]
set atm2 [atomselect top "serial $ind2"]
set atm3 [atomselect top "serial $ind3"]
set vec1x [expr [$atm2 get x] - [$atm1 get x]]
set vec1y [expr [$atm2 get y] - [$atm1 get y]]
set vec1z [expr [$atm2 get z] - [$atm1 get z]]
set vec2x [expr [$atm3 get x] - [$atm1 get x]]
set vec2y [expr [$atm3 get y] - [$atm1 get y]]
set vec2z [expr [$atm3 get z] - [$atm1 get z]]
set sel [atomselect top all]
$sel move [transvecinv [veccross "$vec1x $vec1y $vec1z" "$vec2x $vec2y $vec2z"]]
$sel move [transaxis y 90]
}
Load structure file of your system (.pdb/.xyz/.mol2, etc.) into VMD, assume that 3 10 12 are three atoms in the graphitic carbon nitride, run this command in VMD console window:
alignplane 3 10 12Now you can find the graphitic carbon nitride has been exactly parallel to XY plane. Choose "file" - "save Coordinate" to save to the present structure to a new geometry file.
Then, use your quantum chemistry code to perform single point task for this structure (as well as its fragments or other states) to obtain corresponding wavefunction files, then you will be able to use Multiwfn to plot local integral curve along the direction perpendicular to the surface.
Note that if you use Gaussian to perform the calculation, do not forget to add "nosymm" keyword to avoid automatic reorientation of the system to standard orientation.
Best,
Tian
]]>Thank you so much for your directions. I did go through sections 3.16.14 of Multiwfn manual for introduction and Section 4.13.6 for application example. I just noticed that my graphitic carbon nitride and phosphorene quantum dots do not lie exactly in the xy plane and therefore a perpendicular line drawn to the interface does not align with the z-axis. Is there an option in Multiwfn to transform a molecular system in to the desired orientation?
Thank you! Highly appreciate your advice!
Best,
Dimuthu]]>
The Figure 5c of the RSC Adv. paper cannot be plotted by main function 3. You should generate grid data of electron density difference first using main function 5, and then use subfunction 18 of main function 13 to convert the grid data to local integral curve. Please check Section 3.16.14 of Multiwfn manual for introduction and Section 4.13.6 for application example.
Best,
Tian
]]>I have been following section 4.5.5 in the manual to create electron density difference maps of heterojuctions of graphitic carbon nitride and phosphorene quantum dots. (Δρ(r)= ρ_tot(r)- ρ_phossphorene(r)- ρ_graphitc carbon nitride(r))
I was trying to project electron density difference of such a system on to a perpendicular line. For example if my 2D quantum dots lie in the xy plane, I want to project the electron density difference of the system to a line parallel to the z axis.
(Figure 5c of RSC Adv., 2020,10,5260-5267)
I was trying a similar procedure as in section 4.5.5 in the manual but used option 3 in the main menu (plot in a line) rather than 5(calculate grid data). However, I noticed that my plots vary strangely depending on the x,y,z coordinates of the two points that define the line.
Could you please let me know if this procedure would create reliable results for my problem or if this method is fundamentally wrong to apply for my problem?
Thank you in advance!
Best Regards,
Dimuthu